Upload a CSV and start exploring in minutes — no installation, no coding. Used in geoscience, art history, ecology, archaeology, social science, and university classrooms worldwide.
Free for academic and non-commercial use.
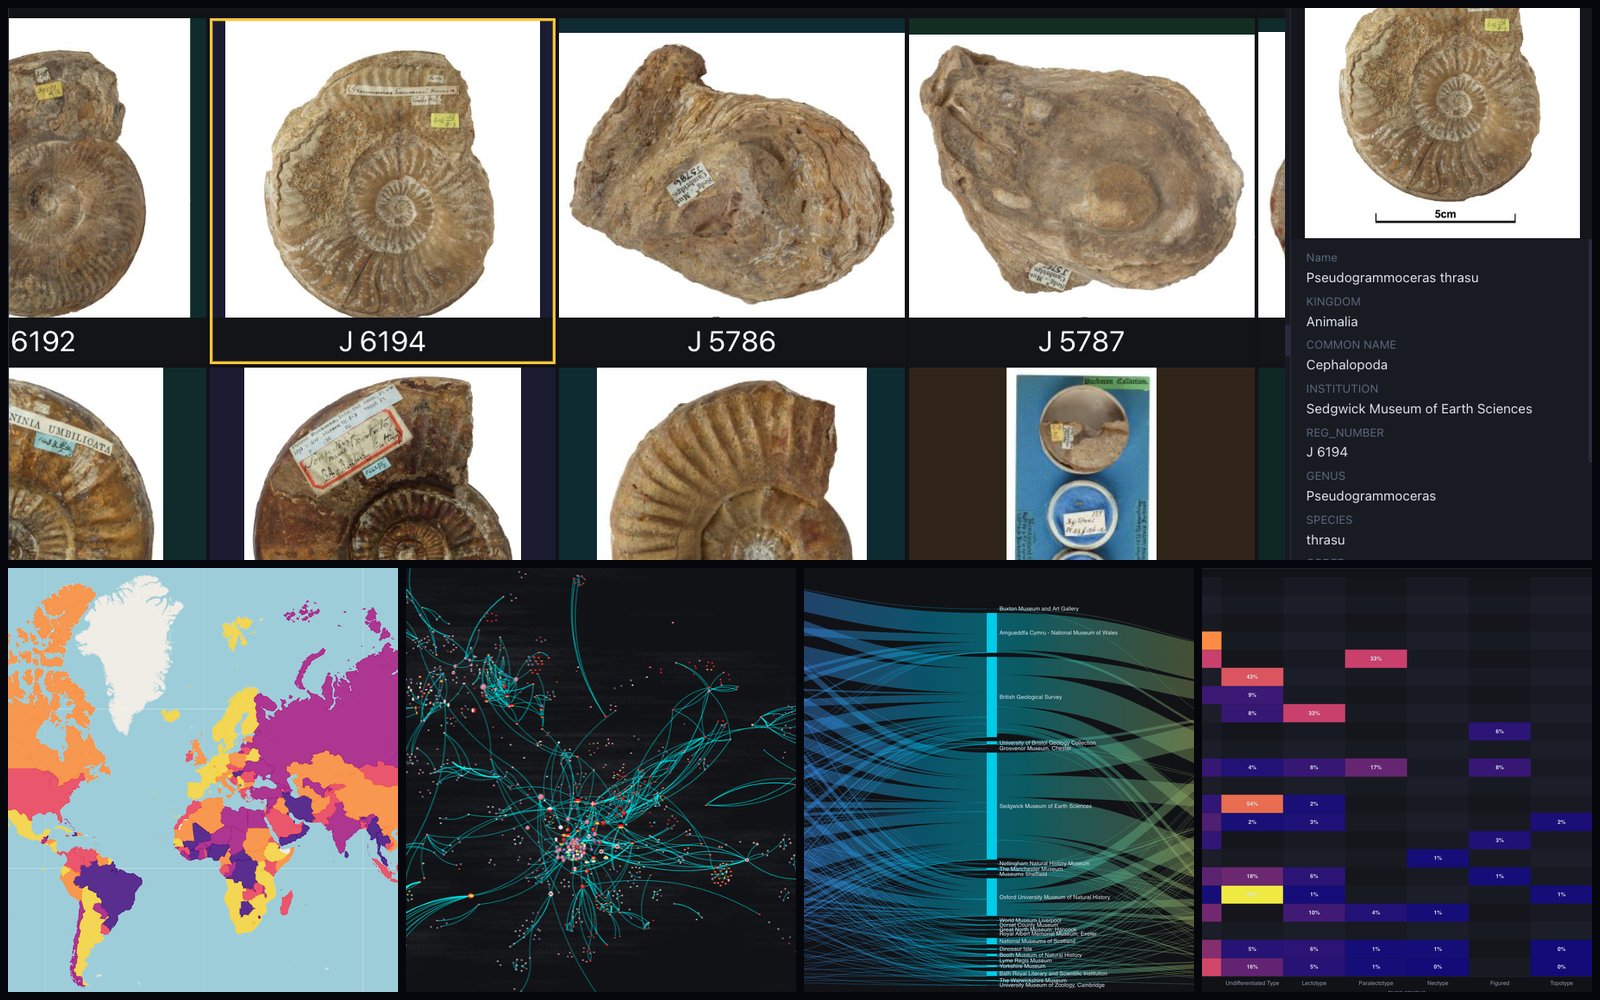
Connect a dataset and start discovering. Images, maps, charts, networks, and advanced analytics all share one filter state — switch views without losing your selection, without re-running queries, without extra tools to install.
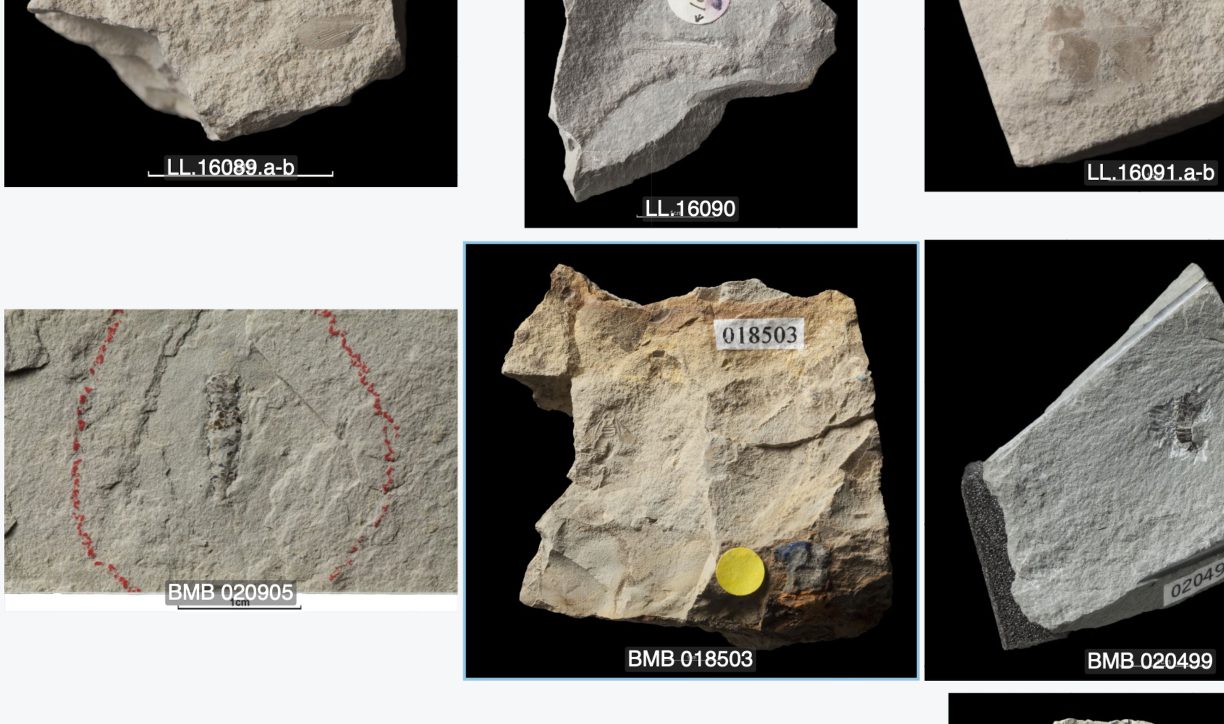
Browse thousands of images, thumbnails, and records in a zoomable grid — filtered instantly by any combination of variables.
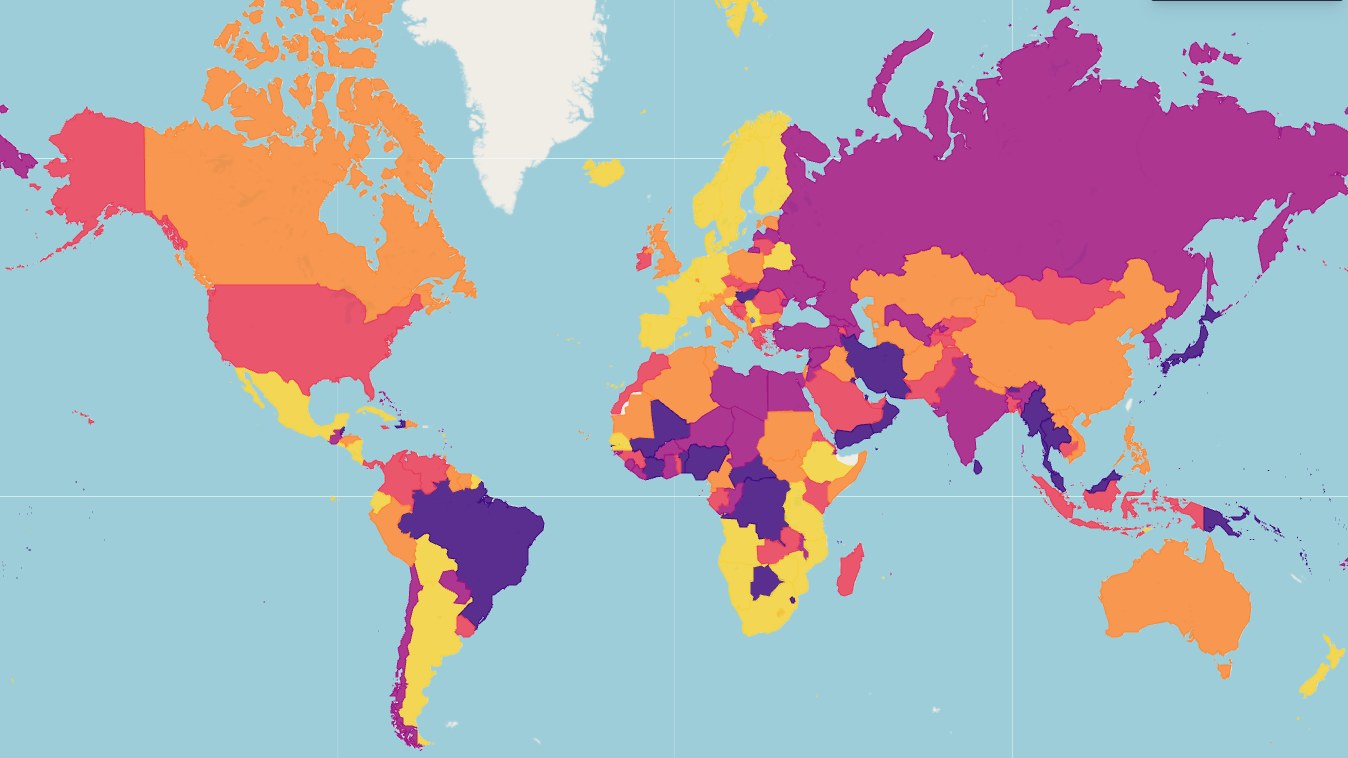
Location data renders automatically as an interactive map where you can color-code, cluster, and filter without ever leaving the view.
Co-authorship, co-occurrence, and citation relationships emerge as interactive graphs that reveal communities and connections across your collection.
Connect Jupyter notebooks or Streamlit apps to run analyses against your live data and see results appear as new columns and views immediately.
Start from a CSV, a Google Sheet, or a connected survey form — free accounts, no installation, no server, no IT department.
Any view with any active selection encodes into a single shareable link — send it and collaborators open SuAVE in exactly your state.
SuAVE connects directly to KoboToolbox and LimeSurvey via REST API. Configure the bridge once — new submissions appear as live records in SuAVE automatically, with no CSV export, no reformatting, and no waiting.
Integration docs →Every view responds to the same filters. Switch between them to discover different facets of the same dataset.
Zoomable image tiles
Clustered point & geometry
Grouped bar charts
Sorted image stacks
Variable cross-tabulation
Image grid by two vars
XY numeric comparison
Research communities & co-occurrence
Sortable spreadsheet view
Compact record-by-record view
Items placed on a date axis
Categorical flow between two variables
A fossil archive, a painter's oeuvre, a co-authorship network — each opens in the same interface, shares a single filter panel, and preserves state in a shareable link.
8,353 fossil specimens from the British Geological Survey, filterable by taxonomy, geological period, and collection site — winner of the 2015 International Data Rescue Award.
UN Sustainable Development Goal indicators for 193 member states, displayed on an interactive map and filterable by goal, regional bloc, performance tier, and over 200 variables.
Co-authorship networks from OpenAlex bibliographic data. Community detection reveals four research clusters with bridge authors spanning disciplines.
Professors at UCSD use SuAVE to teach research methods without requiring students to learn R or Python first. The visual interface makes data exploration immediate and intuitive.
Teaching resourcesStudents spot outliers and patterns before running any statistics.
Connect Limesurvey to push student responses directly into SuAVE.
Students share URL-encoded filter states as their "findings" — no export required.
Advanced students extend analysis with Jupyter without leaving SuAVE.
Works entirely in the browser — no software installation, no VPN.
SuAVE is free for academic use. Publish and share surveys at no cost.
"SuAVE allows students to immediately engage with real survey data visually before they understand the statistics. That first encounter — seeing how two variables relate across hundreds of respondents — changes how they think about data for the rest of the course."— Akos Rona-Tas, Professor of Sociology, UC San Diego
Upload a CSV, add image links, and your survey is live in minutes. No installation.