While polling and forecasting of the 2016 presidential election may not have been far off (within error margins), the outcome defied the widely expected Clinton advantage, leaving many people – pollsters and pundits included – shocked. Numerous explanations for this surprising miss have been proposed: some voters may have been reluctant to admit they were planning to vote for Trump, the media’s focus on scandals rather than policy analysis, the illusion of parity between opposing positions, the FBI’s intervention 10 days before November 8th (too late to affect polling), and the demotivating effect of polls that prematurely suggested a Clinton victory. More explanations may emerge, but one clear issue is that “horse race” polls are not designed to uncover or explain deeper patterns and shifts in voter sentiment. Such depth requires larger surveys with a broader set of questions. In stock market terms, technical analysis (polling) should be supported by a fundamental analysis of voter attitudes. We need not only better data but also better methods to query, visualize, and interpret it.
To gain insight, let’s explore the 2016 American National Election Survey (ANES) Pilot. Although it has limitations (it’s an opt-in online panel, we’re using the initial release from January 2016, and it may contain data errors), it offers a wealth of data on political preferences and stereotypes.
One critical issue for the Clinton campaign was engaging women. Yet Republican women strongly preferred Trump. Was it effective to try to attract them by emphasizing issues assumed to be important to women? This raises a reasonable question: do Republican women’s views align more with Republicans in general or with women in general? Should they have been treated as a distinct target group? That might be a natural conclusion from “horse race” polling, where gender and party affiliation are commonly noted—but does it reflect reality, or would it skew campaign planning? What are Republican women’s attitudes on women’s issues?
The 2016 ANES Pilot provides some interesting answers. Open this survey in SuAVE and explore along.
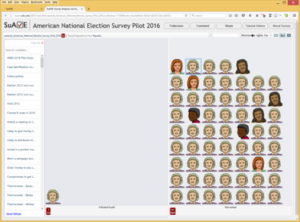
- Open the survey in SuAVE and switch to bucket view (the second icon at the top right). To filter for Republican women, type “Gender” into the “Search variables…” box, expand the “Gender” variable in the left frame, and check “Female.” Then type “repub” in the same search box, expand “PartyID Republican First,” and check “Republican.” Now you’ll see icons representing Republican women, which you can explore by clicking each icon to view individual responses or by selecting variables from the drop-down menu.

87 percent of Republican women voted in 2012
For example, here is how this group voted in 2012: 87% of Republican women in this sample definitely participated in the 2012 election, indicating they are a politically engaged group worth following.
- To examine how this group aligns with common stereotypes, type “Obama” in the search box, and select “Barack Obama is/is not a Muslim” from the drop-down. The result is striking: 68% of Republican women think Obama is a Muslim (See it in SuAVE). By clicking “more info” next to the red count box, you’ll see numeric in

61 percent of Republicans believe that Obama is a Muslim; 68 percent among Republican women
sights: being both Republican and female increases the likelihood of this belief.
Removing the gender filter reduces this percentage to 61% among Republicans in general (or 75 out of 123 Republicans in the survey.) See this result in SuAVE. In other words, Republican women are even more likely than Republican men (54%) to believe this statement.
“Women’s rights most important for choosing a political candidate” only ranked fourth by one person among Republican women
- Next, type “women” in the search box and select “Women’s rights most important for choosing” [a political candidate]. Only one Republican woman in this group ranked this issue among her top priorities, and she placed it fourth (See it in SuAVE.)
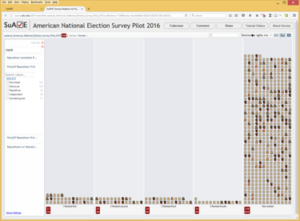
Overall, 92 women ranked women’s rights among the first four priorities
Removing the “Republican” filter gives a very different picture: across all political affiliations, 92 women ranked women’s rights among their top four issues. Typing “most important” in the search box allows you to explore other prioritized issues, including gun control, health, national debt, environment, and morality.
In summary: Republican women, as a group, are less concerned with women’s rights and are sometimes more conservative than Republican men on certain issues. This suggests that treating Republican women as a distinct group of voters may not be necessary or may even mislead campaign planning, as they tend to align much more closely with Republican views than with those of women generally.
Note: This text demonstrates how SuAVE can be used to explore a large survey dataset, focusing on one example where deeper analysis might have improved strategy and predictions. It does not attempt to fully analyze the reasons for the election outcome; for that, see CNN’s list of 24 theories, or the detailed discussions on FiveThirtyEight about polling missteps.
– Ilya Zaslavsky
