
SuAVE for International and Global Projects
SuAVE has been used to explore international development data and surveys, and present collections assembled in the course of several global-scale projects. Some of them are highlighted on this page.
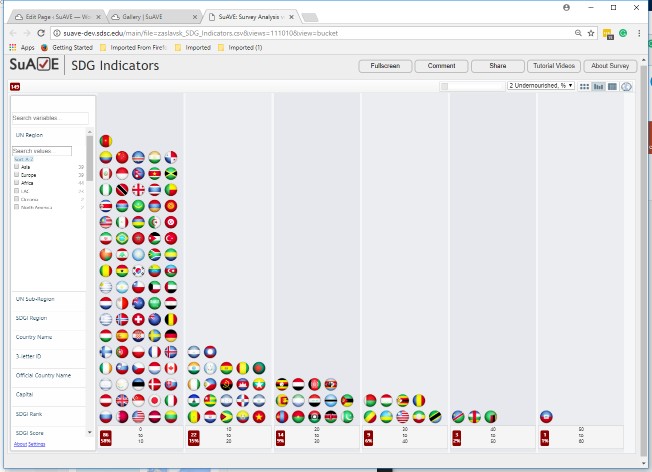
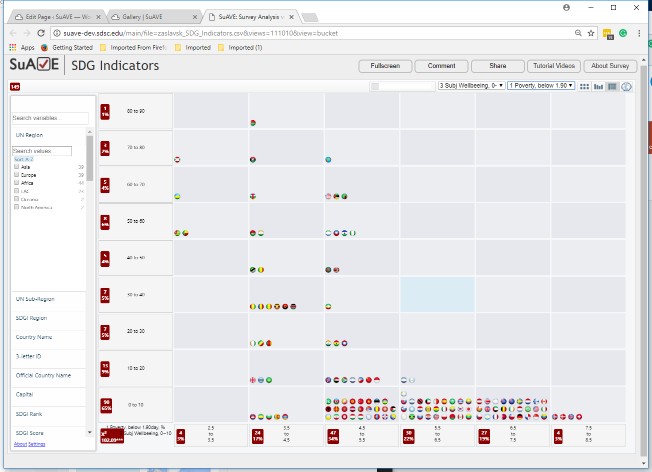
SDG indicators. Sustainable Development Goals is a set of 17 "Global Goals" adopted by the UN as part of the 2030 Agenda for Sustainable Development. This application shows baseline values of over 90 target indicators for the 17 goals. SuAVE makes it straightforward to explore individual indicator values for each country or visualize spatial and statistical distributions of countries by such values, understand correlations between indicators, and share findings with other members of the international team. For example, you can correlate subjective well-being (an indicator under Goal 3) with "objective" measures such as poverty levels, number of physicians per capita, sanitation, etc. Try it out to see which countries are outliers in this space!
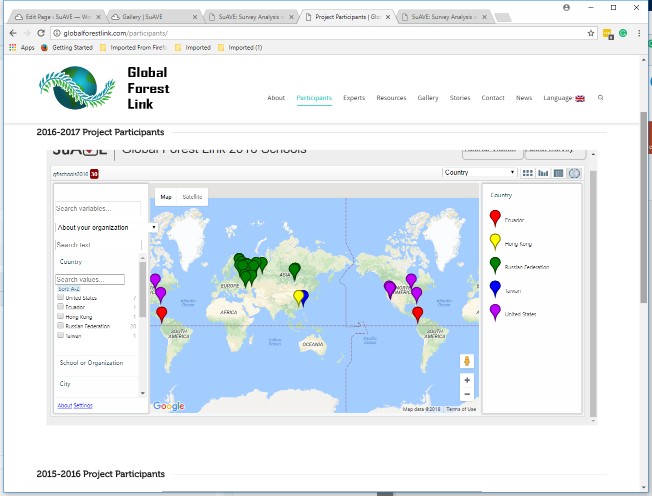
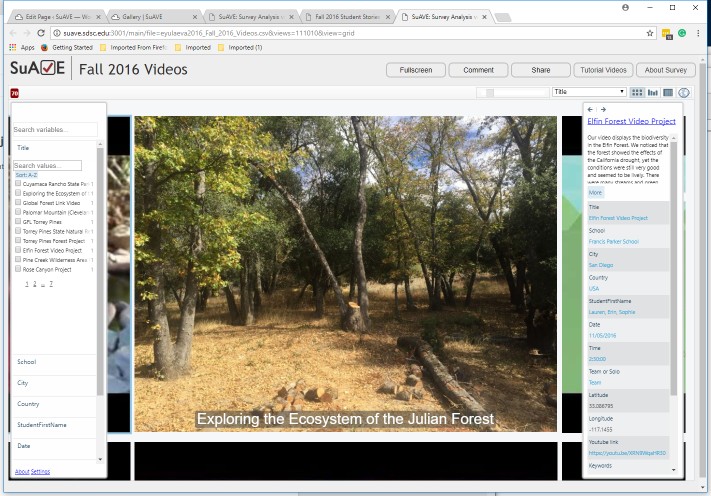
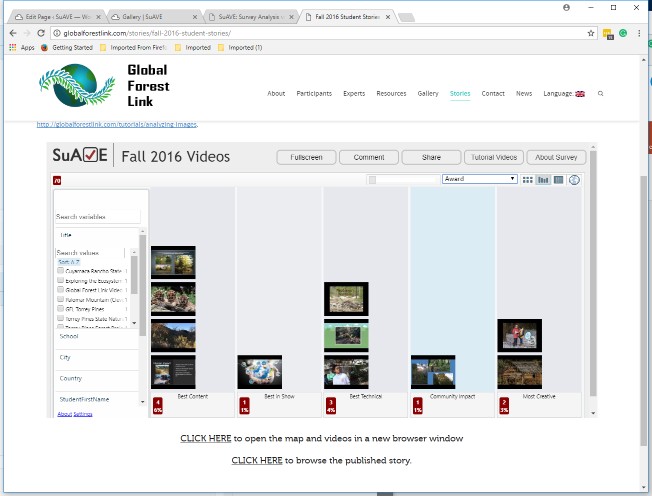
Global Forest Link is a global-scale education project that connects youth from multiple countries and schools studying local forest health and exploring forest trends across the globe. Students from over 100 schools and youth groups have been collecting forest photos and metadata, developing digital stories, and sharing them with their peers. Georeferenced forest photos and videos are linked with the Global Forest Watch monitoring and analysis platform, making it easier for students to connect local forest changes with global trends. The GlobalForestLink website includes several SuAVE applications, as well as project learning modules, videos, information about participants, etc.
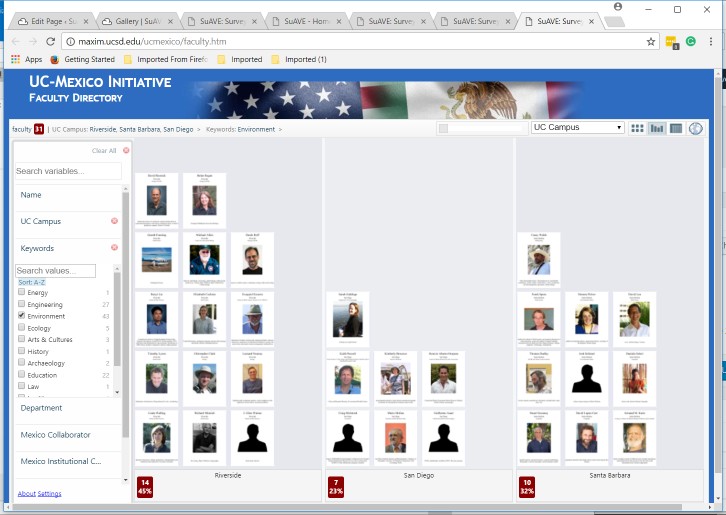
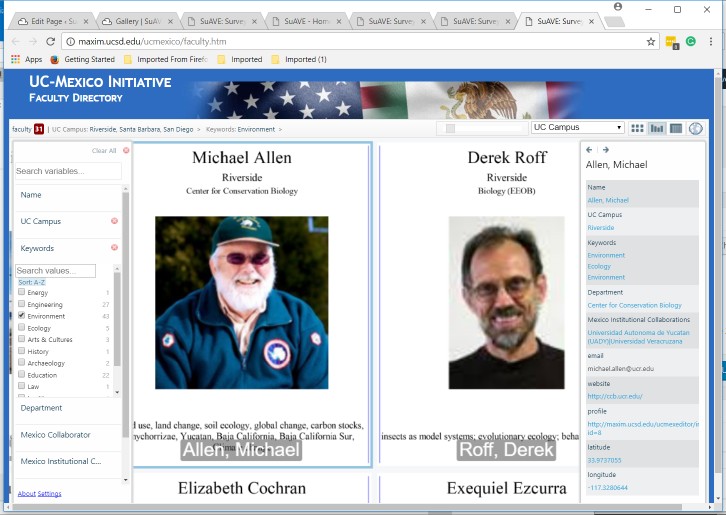
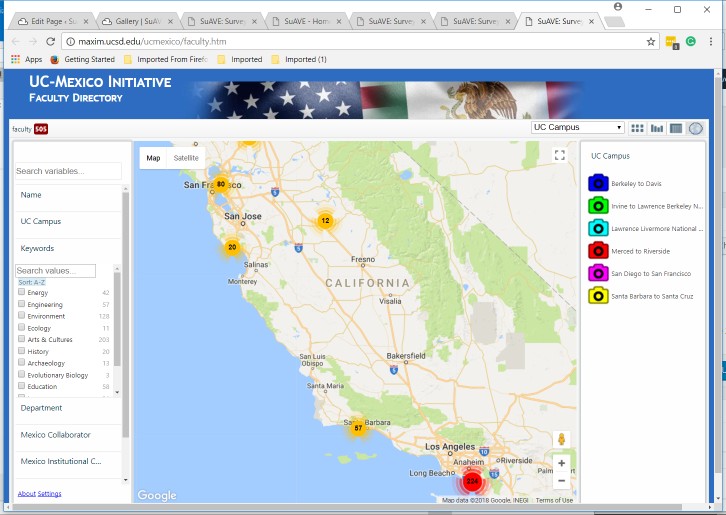
International project galleries. SuAVE is often used to present galleries of project participants. This is especially useful in large projects that span multiple institutions and countries. Here you can find partners with matching profiles, explore their research interests and domains of expertise, and visit associated web pages or other materials. Often, such galleries are not static: project members want to update their information or upload new photographs. The gallery on the left presents a directory of faculty in the UC system who are partnering with institutions and researchers in Mexico. It is developed as part of the Alianza UCMX systemwide initiative of the University of California, Office of the President. With these galleries, you can find UC faculty members from any campus, for any research domain. Similar galleries of project members have been developed for members of the NSF EarthCube project, multi-site Critical Zone Observatories, the Society for Advancement in Social Economics, the Transboundary Groundwater Resilience project, and many others.
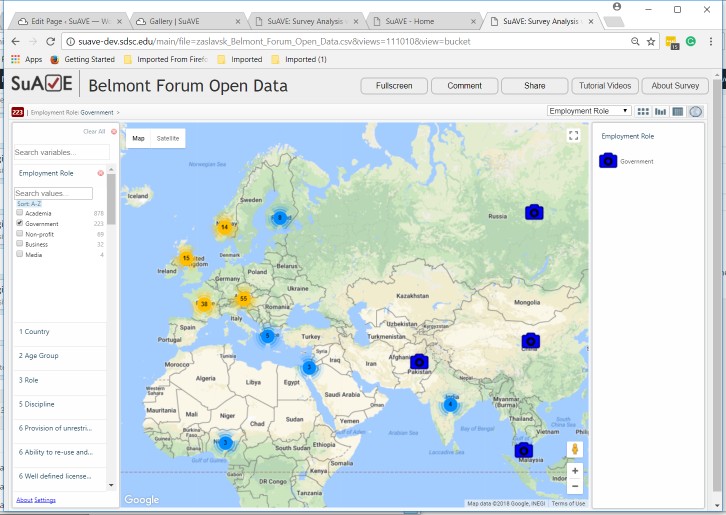
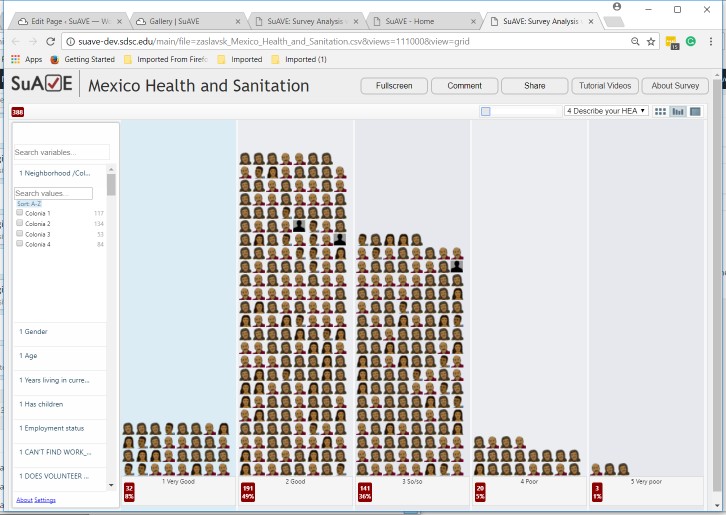
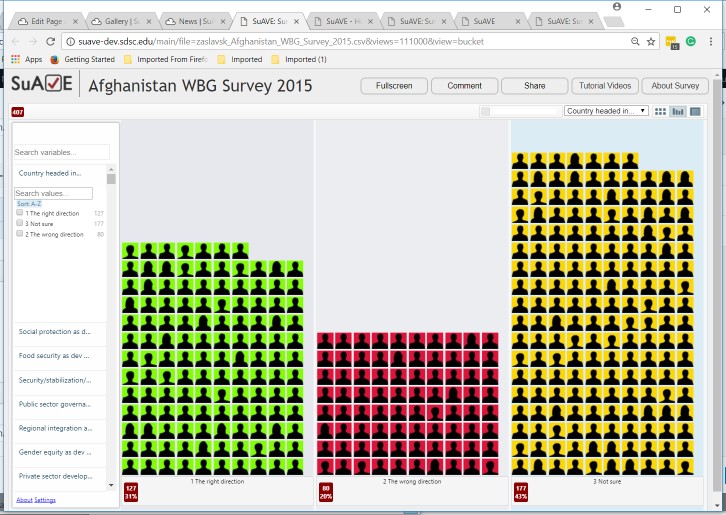
International surveys. Household surveys are used to monitor local socio-economic and demographic patterns and trends; they provide a wealth of information for teams focused on international development. SuAVE lets such teams explore survey data together, exchange survey views with international collaborators, and share interpretations of the data as annotations. Click on the images on the left to explore some of these surveys: a household survey conducted in Afghanistan and registered in the World Bank’s collection of household surveys (for example, check responses to a question whether the country is going in the right direction, and see how the responses depend on gender, occupation, development priorities, or other factors); the Belmont Forum Open Data Survey, and the Mexico Colonias Health and Sanitation survey. There are many more political, social and electoral surveys loaded on SuAVE.
Additional Applications
- Ukraine 2017: European Values Study, from GESIS Survey Archive
- Russia 1999: European Values Study, from GESIS Survey Archive
- 2017 Women, Peace, and Security Index, from Georgetown University (note polygon maps, and a Jupyter connection to compute additional variables)
- Household Survey of Health, Healthcare, Hygiene, and Social Conditions in 4 Colonias in Mexico, 2013-2014
- Afghanistan Household survey from WBG, 2015
- AfroBarometer survey for Uganda (household survey on multiple topics)
- Georgian Food Recipes, Jordan Food,
- 2018 Ambient Air Quality Database, World Health Organization
- Selected international comparisons from the 2018 Science and Engineering Indicators, National Science Board
- Science and Engineering Articles, by country, year, and discipline (explore dynamics of the US vs China, for example)
- Number of patents granted by the US Patent Office
- Intellectual Property exports and imports
- Venture Capitalist Investments
- Plans of foreign recipients of U.S. doctorates to stay in the United States
- 2018 SDG Index, from the 2018 SDG Index and Dashboards report, at www.sdgindex.org/reports. Using a Jupyter notebook, one can add more indicators into SuAVE, selecting from the Oct 10, 2018, version of the SDG Indicators database compiled by the UN Statistics Division (see https://unstats.un.org/sdgs/indicators/database/).
- A new version of SuAVE can generate worldwide academic co-authorship networks using bibliographic data from OpenAlex.org. See the recently updated SuAVE for Organizations page for examples of using SuAVE for the visualization and analysis of the network of researchers working on transboundary groundwater issues.