
SuAVE in the Classroom
Since 2016, SuAVE has been used in classes at UCSD to help students master practical data analysis and data science techniques, collect opinions and feedback, and visualize data collection and research outcomes in a gallery where individual contributions can be compared and annotated. In addition, several high schools around the world have used SuAVE to organize and visualize data and photographs collected by students as part of the Global Forest Link project.
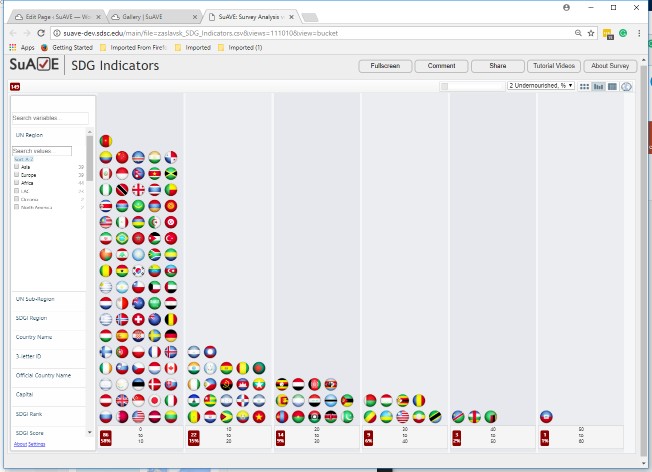
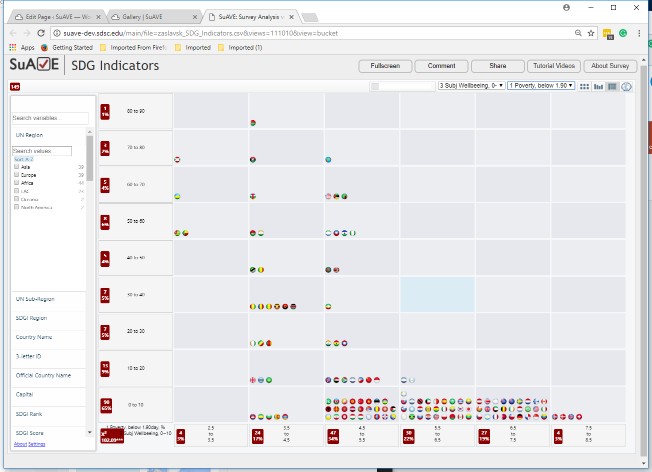
Data Analysis. SuAVE has been used in research methods classes (see Prof. Akos Rona-Tas describing the use of SuAVE to analyze General Social Survey in his classes). In a spatial data science class, SuAVE has been used to demonstrate exploratory analysis of Sustainable Development Goal indicators and compute a range of spatial statistics using SuAVE Jupyter notebooks. The notebooks can be automatically launched from SuAVE for the current dataset. They implement a variety of operations, including computation of additional variables, text analysis, image processing, computation of statistical and machine learning models, generation of maps based on survey data, and additional exploratory data analysis and visualization.
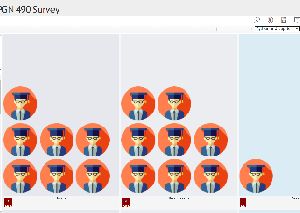
Student surveys. In several classes, we have used an integration of SuAVE and Limesurvey to publish questionnaire surveys and make the results immediately available for analysis. See for example, a survey of student feedback in UCSD GPGN490 course, with results added to a SuAVE application, using these mappings between Limesurvey and SuAVE fields. The bridge between Limesurvey and SuAVE enables survey responses, including images and spatial data, to be automatically added to a SuAVE gallery for analysis, annotation, and sharing.
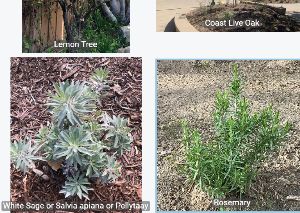
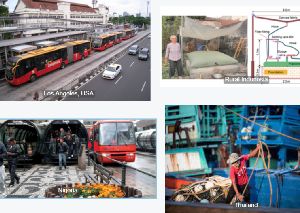
Organizing data collection and project submissions. In several UCSD classes, from introductory World Urbanization to upper-division Sustainable Development and Senior Sequence capstone, students collected primary data such as characteristics of food-producing trees, or organize and compare descriptions of world cities, or submit their research into a class project gallery in SuAVE for peer comparison and annotation. In these applications, information submitted through a survey software (Limesurvey) is automatically mapped to SuAVE fields and added to a SuAVE gallery.
Examples include: Foodscapes gallery (survey, mappings),
Sustainability Best Practices (survey, mappings),
Senior Sequence Projects (survey, mappings),
USP2 Urban Development Challenges (survey, mappings).
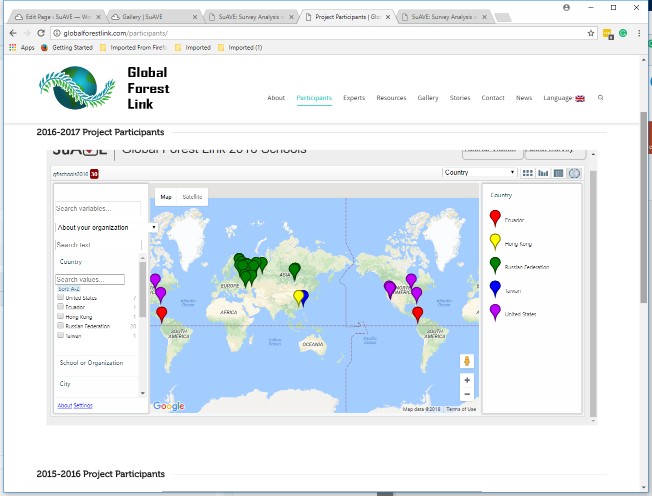
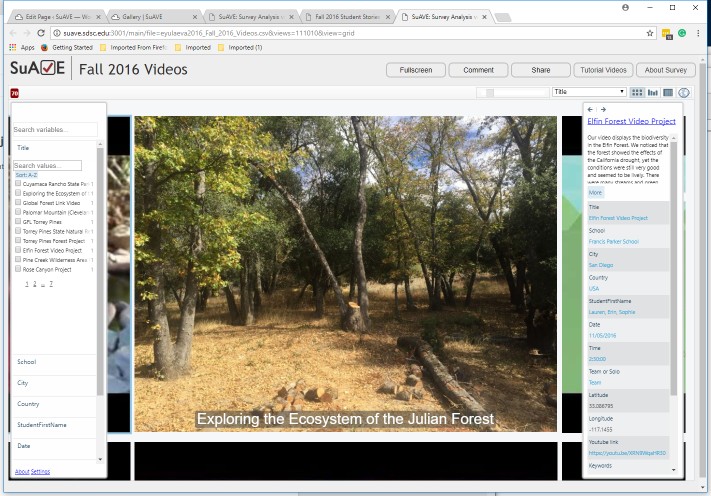
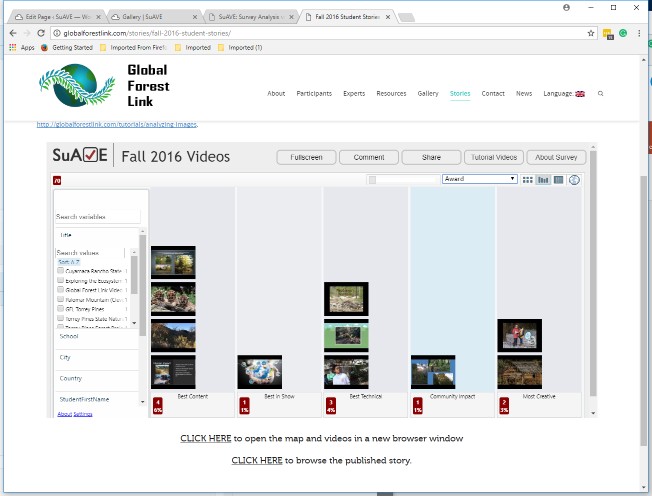
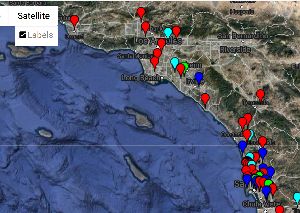
Global Forest Link is a global-scale education project that connects youth from multiple countries and schools studying local forest health and exploring forest trends across the globe. Students from over 100 schools and youth groups have been collecting forest photos and metadata, developing digital stories, and sharing them with their peers. Georeferenced forest photos and videos are linked with the Global Forest Watch monitoring and analysis platform, making it easier for students to connect local forest changes with global trends. The GlobalForestLink website includes several SuAVE applications, as well as project learning modules, videos, information about participants, etc.